
With an automated setup with real-time insights into the company’s performance data, CFO Mads Bodenhoff has increased efficiency, reduced time spent on manual reports and most importantly: created a basis for making better business decisions in NKT Photonics.
High-quality data is a necessity in the work of a modern CFO. Without solid data, you operate blindly and are forced to manage the company without real insights into where you are coming from and in which direction to move the company.
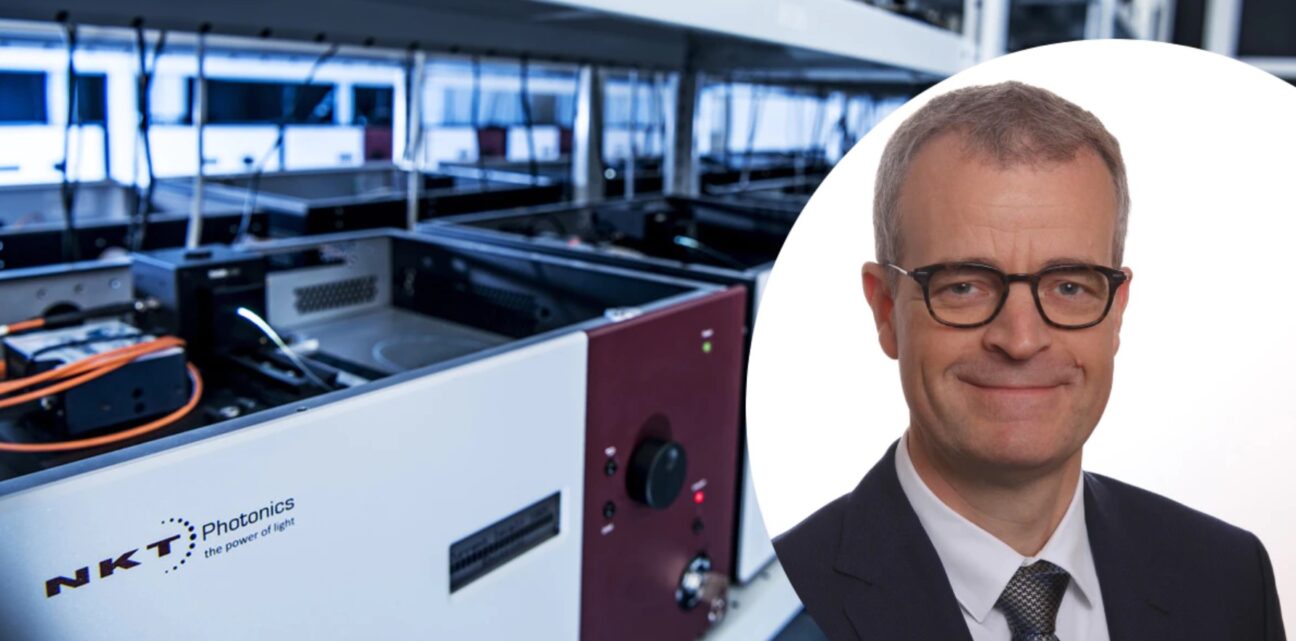
No-one knows this better than Mads Bodenhoff, CFO of NKT Photonics. In two years, he has changed the company’s use of data from a time-consuming and cumbersome duty to an intuitive, value-adding tool for a large group of employees – and not just in the finance department.
MADS BODENHOFF
We had very, very poor data transparency. All I could see, more or less, were the total sales figures. The reports were collected manually from many different systems, so their accuracy was questionable as well
Data collection and automation
After having had to make decisions based on data of questionable quality, he decided to find a better solution for the company. He needed data that was accurate, up-to-date and easily accessible.
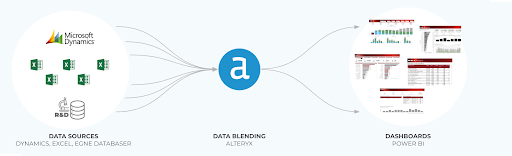
“I knew that one of our problems was that data was generated in different systems and compiled manually. This was the first problem to which we had to find a solution. And that solution became a collaboration with Devoteam Data Driven, who compiled it all with Alteryx,” says Mads Bodenhoff.
The result of the collaboration is a setup in which data from various systems (including Microsoft Dynamics, a proprietary R&D database and spread sheets from local departments) is blended in an Alteryx solution and then visualized simply and intuitively across +40 different Microsoft Power BI dashboards that are updated in real time – completely automatically and with built-in quality control.
“If data isn’t accurate, you will make the wrong decisions.” With dashboards that update automatically and visualize data from many different data sources, Mads Bodenhoff gets the overview needed to make critical business decisions.
Now we know where to take action
With the relevant data compiled in dashboards showing orders, sales, opportunities, production, inventory, and more, management can fulfil their actual purpose: leading the business.
Mads Bodenhoff says:
“Now we can discuss the actual problem – because we can see where to take action. In the past, we could only discuss problems at a very general level and see, for instance, that a figure was too high or too low. Now we can see exactly why that is the case, and we have the knowledge to make decisions quickly. With a few clicks, we can go through the different dashboards and see which areas we need to scrutinize.”
In other words: Mads Bodenhoff and the management team have accurate knowledge on which to base their decisions. For example, they can quickly assess which sales order should be prioritized in the production, or pinpoint which KPIs they might need to make a special effort to reach.
“The numbers are constantly updated because they are pulled directly from the systems, and we can trust them because all the reports also have a second page which validates the data quality,” he says, and continues: “If data is inaccurate, your decisions will be wrong.”

NKT Photonics’ lasers are found in outer space and far below sea level and are used in anything from clinical trials to oil rigs at sea.
Profitability analysis: Where are we making our profits right now?
Among the dashboards and reports custom built for NKT Photonics by Devoteam Data Driven is a detailed profitability analysis. By combining data from a variety of sources (sales, production, HR, etc.), the dashboard shows how profitable each product or customer is for NKTP.
“The profitability analysis is a very important tool for us, and one that I use a lot. It clearly shows that Alteryx and Power BI are great tools for displaying the insights we need. It is the largest project we have conducted with Devoteam Data Driven, and it has great value for us. It is particularly useful in my collaboration with our salespeople, marketing, production and other parts of the organization. We study the data together and find out exactly where the problems are and what we can do,” Mads Bodenhoff says.
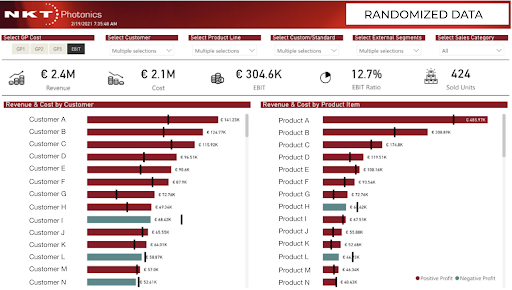
With dashboards like this, CFO Mads Bodenhoff can constantly track revenue and costs for each product and customer. By clicking the individual products and customers, he can delve deeper into the analyses of each element.
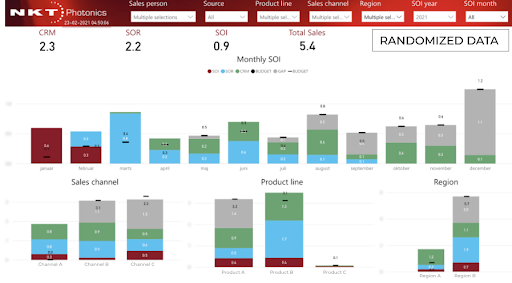
With over 40 dashboards, Mads Bodenhoff and NKT Photonics have access to detailed information on many different aspects of the organisation.
A transformation that ripples through the organisation
Using data to improve the business is not just relevant for CFOs. In Mads Bodenhoff’s view, data can improve the entire organisation, and, from the wide use of dashboards, it is clear that people from other departments are tracking data too. Among other things, he launched a data project with Devoteam Data Driven in NKT Photonic’s fibre production department. It turned out that data was being collected but not utilized at all, and many processes were manual.
“If you are curious and listen to people in the organization, you will learn where processes are efficient and where they are not. There are extremely high efficiency gains to be found. If a task is done habitually every month, why not automate it and get the insight every day? Speed has great value, and this is precisely how data can yield big gains. Usually, you can get started quickly by compiling data in an Alteryx model and combine it with Power BI,” concludes Mads Bodenhoff.

NKT Photonics produces lasers and optical fibres at their factory in Birkerød north of Copenhagen. The fibres are produced by pulling them onto coils at high temperatures. By collecting and visualizing data about the production, the company has increased the efficiency and quality of production.
How to get started?
“I have worked for some of Denmark’s largest companies, and I know how difficult it is to make good BI solutions. And although we are a smaller company, we have the same complexity when it comes to different systems, locations and business units,” says Mads Bodenhoff.
“But because I had worked with Devoteam Data Driven before, I knew that, today, you can do things much faster than you could possibly imagine a few years ago. You have to have a go-do-it attitude and embark on a small but important data project. Then you will see how it ripples from there,” he concludes.
At Devoteam Data Driven, we are experts at helping companies turn raw data into business value. Book us for a meeting on the phone and let’s talk about how we can help your company.

